Toggle navigation
eCalc
chargeCalc
chargeIndex
Buyer's Guide
Help
Profile
Sign-up
Login
6'070'731 simulated EV trips
e
Calc
−
ev
Calc
− #r
EV
olution
ev
Calc
−
Charge & real Range
− #r
EV
olution
Full-Version
Language:
-
Feedback
Trip Information
Next Waypoint:
Street Condition:
dry
damp
wet
slush
compacted snow
Temperature:
°C
°F
min Charging Speed:
kW
Charger within:
km
mi
>150kW
81..150kW
46..80kW
23..45kW
12..22kW
8..11kW
4..7kW
<4kW
Distance:
100
km
Driving Time:
1.25
h
Mean Speed:
80
km/h
Mean Elevation:
300
m
Upslope:
300
m
Downslope:
300
m
Topography status:
low
Electric Car
Cost- and CO
2
-Analysis
Car Maker - Type (model year):
Nominal Capacity:
-
/
-
kWh
select...
custom
Accessory Consumption:
off
low
normal
high
very high
Thermal BMS:
off
on - low
on - normal
on - high
on - very high
Battery Degradation:
%
Payload (incl. Pax):
kg
lbs
Type of Tire:
Summer
All-Weather
Winter
Tire Pressure:
lower
acc. manufacturer
higher
source
:
-
usable Capacity:
kWh
max. Speed:
km/h
mph
Curb Weight:
kg
lbs
Drag Coefficient:
Frontal Area:
m²
sq.ft
EPA Range:
km
max Charging:
kW
from:
%
to:
%
Eff. Regeneration:
%
Figure of Merit:
%
Eff @ max. Speed:
%
Charge Strategy
SoC @ Departure:
%
min. SoC @ Destination:
%
SoC Recharge:
%
SoC @ Charge End:
%
Charging Speed:
kW
max.
-
kW
Time to Connect:
min
Expert Settings
Wind:
km/h
mph
Distance:
km
mi
Ø Speed:
km/h
mph
Mean Elevation:
m.ASL
ft.ASL
Upslope:
m
ft
Downslope:
m
ft
Wind Model:
static Wind
simulated Wind
Slope as Tunnel:
%
Speed Factor:
x
Tire Energy Lable:
A
B
C
D
E
F
G
Benchtesting:
current cars only
all cars
Units for Results:
metric
imperial
Trailer
Weight:
kg
lbs
Drag Coefficient:
min.
-
Frontal Area:
m²
sq.ft
calculate
share
Remarks:
Real Range @100 km/h
Consumption @100 km/h
Econ Speed
Cd*A
Roll Force
En-Route Consumption and SoC
(
Travel Time:
-
Charge Time:
-
Driving Time:
-
Wind:
km/h)
Distance
Route Analyisis:
-
−
Econ
@
-
km/h
(
Distance: -km, Upslop: -m, Downslop: -m, Wind: -km/h, Topo: -
)
Select a speed from Route Analysis to benchmark your car
Benchmarking at
-
km/h
Comparison
¹ °car is discotinued and out of production.
¹ Range is based on fully charged battery capacity only (REX and ICE on PHEVs are NOT considered)
² car specifications contain assumptions, leading to reduced accuracy - data will be updated as soon as known.
³assuming Fast Charging at 85% of the charge capability of the car.
Version: E / Data: with evCars
...calculating...
Here Comes the Message
Here Comes the Message
×
Betreiber:
Adresse:
Anschlüsse:
Stellplätze:
Kosten:
Nutzung:
Station ID:
Car Overview
×
|
Links to Car Maker
Aiways
U5² (2019)
source:
Wikipedia
by Alexander Migl
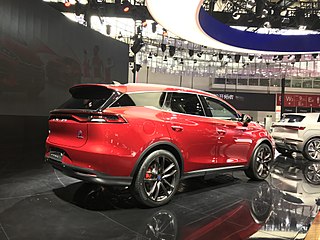
U6² (2022)
source:
Wikipedia
by China Street Shots
Aptera
source:
Wikipedia
by Aptera Motors
source:
Wikipedia
by Aptera Motors
source:
Wikipedia
by Aptera Motors
source:
Wikipedia
by Aptera Motors
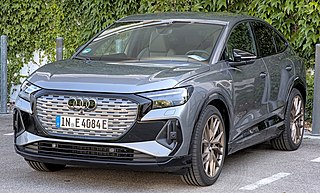
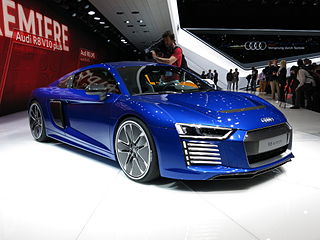
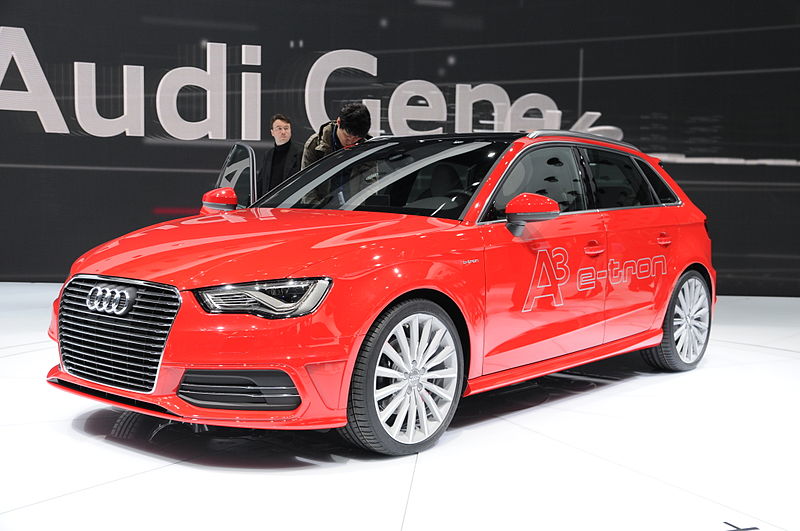
Audi
e-tron 50 Quattro (2020)
source:
Wikipedia
by J. Maciejewski
e-tron 55 Quattro (2020)
source:
Wikipedia
by J. Maciejewski
e-tron S Quattro² (2020)
source:
Wikipedia
by J. Maciejewski
e-tron Sportsback 50 Quattro² (2020)
source:
Wikipedia
by Matti Blume
e-tron Sportsback 55 Quattro (2020)
source:
Wikipedia
by Matti Blume
e-tron GT (2021)
source:
Wikipedia
by Alexander Migl
e-tron RS (2021)
source:
Wikipedia
by Alexander Migl
Q4 e-tron 35² (2021)
source:
Wikipedia
by M93
Q4 e-tron 40² (2021)
source:
Wikipedia
by M93
Q4 e-tron 45 quattro² (2021)
source:
Wikipedia
by M93
Q4 e-tron 50 quattro² (2021)
source:
Wikipedia
by M93
Q4 e-tron 35 Sportback² (2021)
source:
Wikipedia
by M93
Q4 e-tron 40 Sportback² (2021)
source:
Wikipedia
by M93
Q4 e-tron 50 Sportback quattro² (2021)
source:
Wikipedia
by M93
e-tron 55 QUATTRO° (2019)
source:
Wikipedia
by J. Maciejewski
e-tron 55 QUATTRO (no mirror)° (2019)
source:
Wikipedia
by J. Maciejewski
R8 e-tron 2.0° (2016)
source:
Wikipedia
by Noebu
R8 e-tron° (2015)
source:
Wikipedia
by Overlaet
A3 Sportsback e-tron° (2014)
source:
Wikipedia
by Noebu
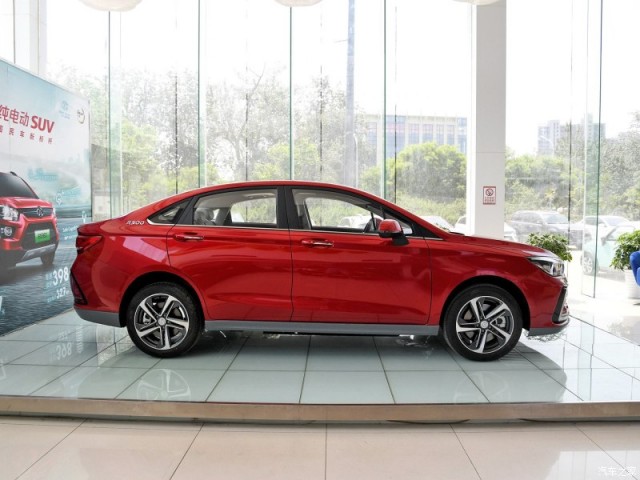
BAIC Motors
EX5 EV (2019)
source:
Wikipedia
by Jengtingchen
EU5 EV (2018)
source:
chinacarforums
by dimitra
EC3 EV (2018)
source:
Wikipedia
by Jengtingchen
BMW
i3s 120Ah BEV (2019)
source: Photo by Ch. Karatsonyi
i3 120Ah BEV (2019)
source:
Wikipedia
by Vauxford
i3 120Ah REX¹ (2019)
source:
Wikipedia
by Vauxford
i4 eDrive 40² (2022)
source:
Wikipedia
by Alexander Migl
i4 M50² (2022)
source:
Wikipedia
by Alexander Migl
iX1 xDrive 30² (2023)
source:
Wikipedia
by AutobildEs
iX xDrive 40² (2022)
source:
Wikipedia
by Alexander Migl
iX xDrive 50² (2022)
source:
Wikipedia
by Alexander Migl
iX M60² (2023)
source:
Wikipedia
by Alexander Migl
i7 xDrive 60² (2023)
source:
Car and Driver
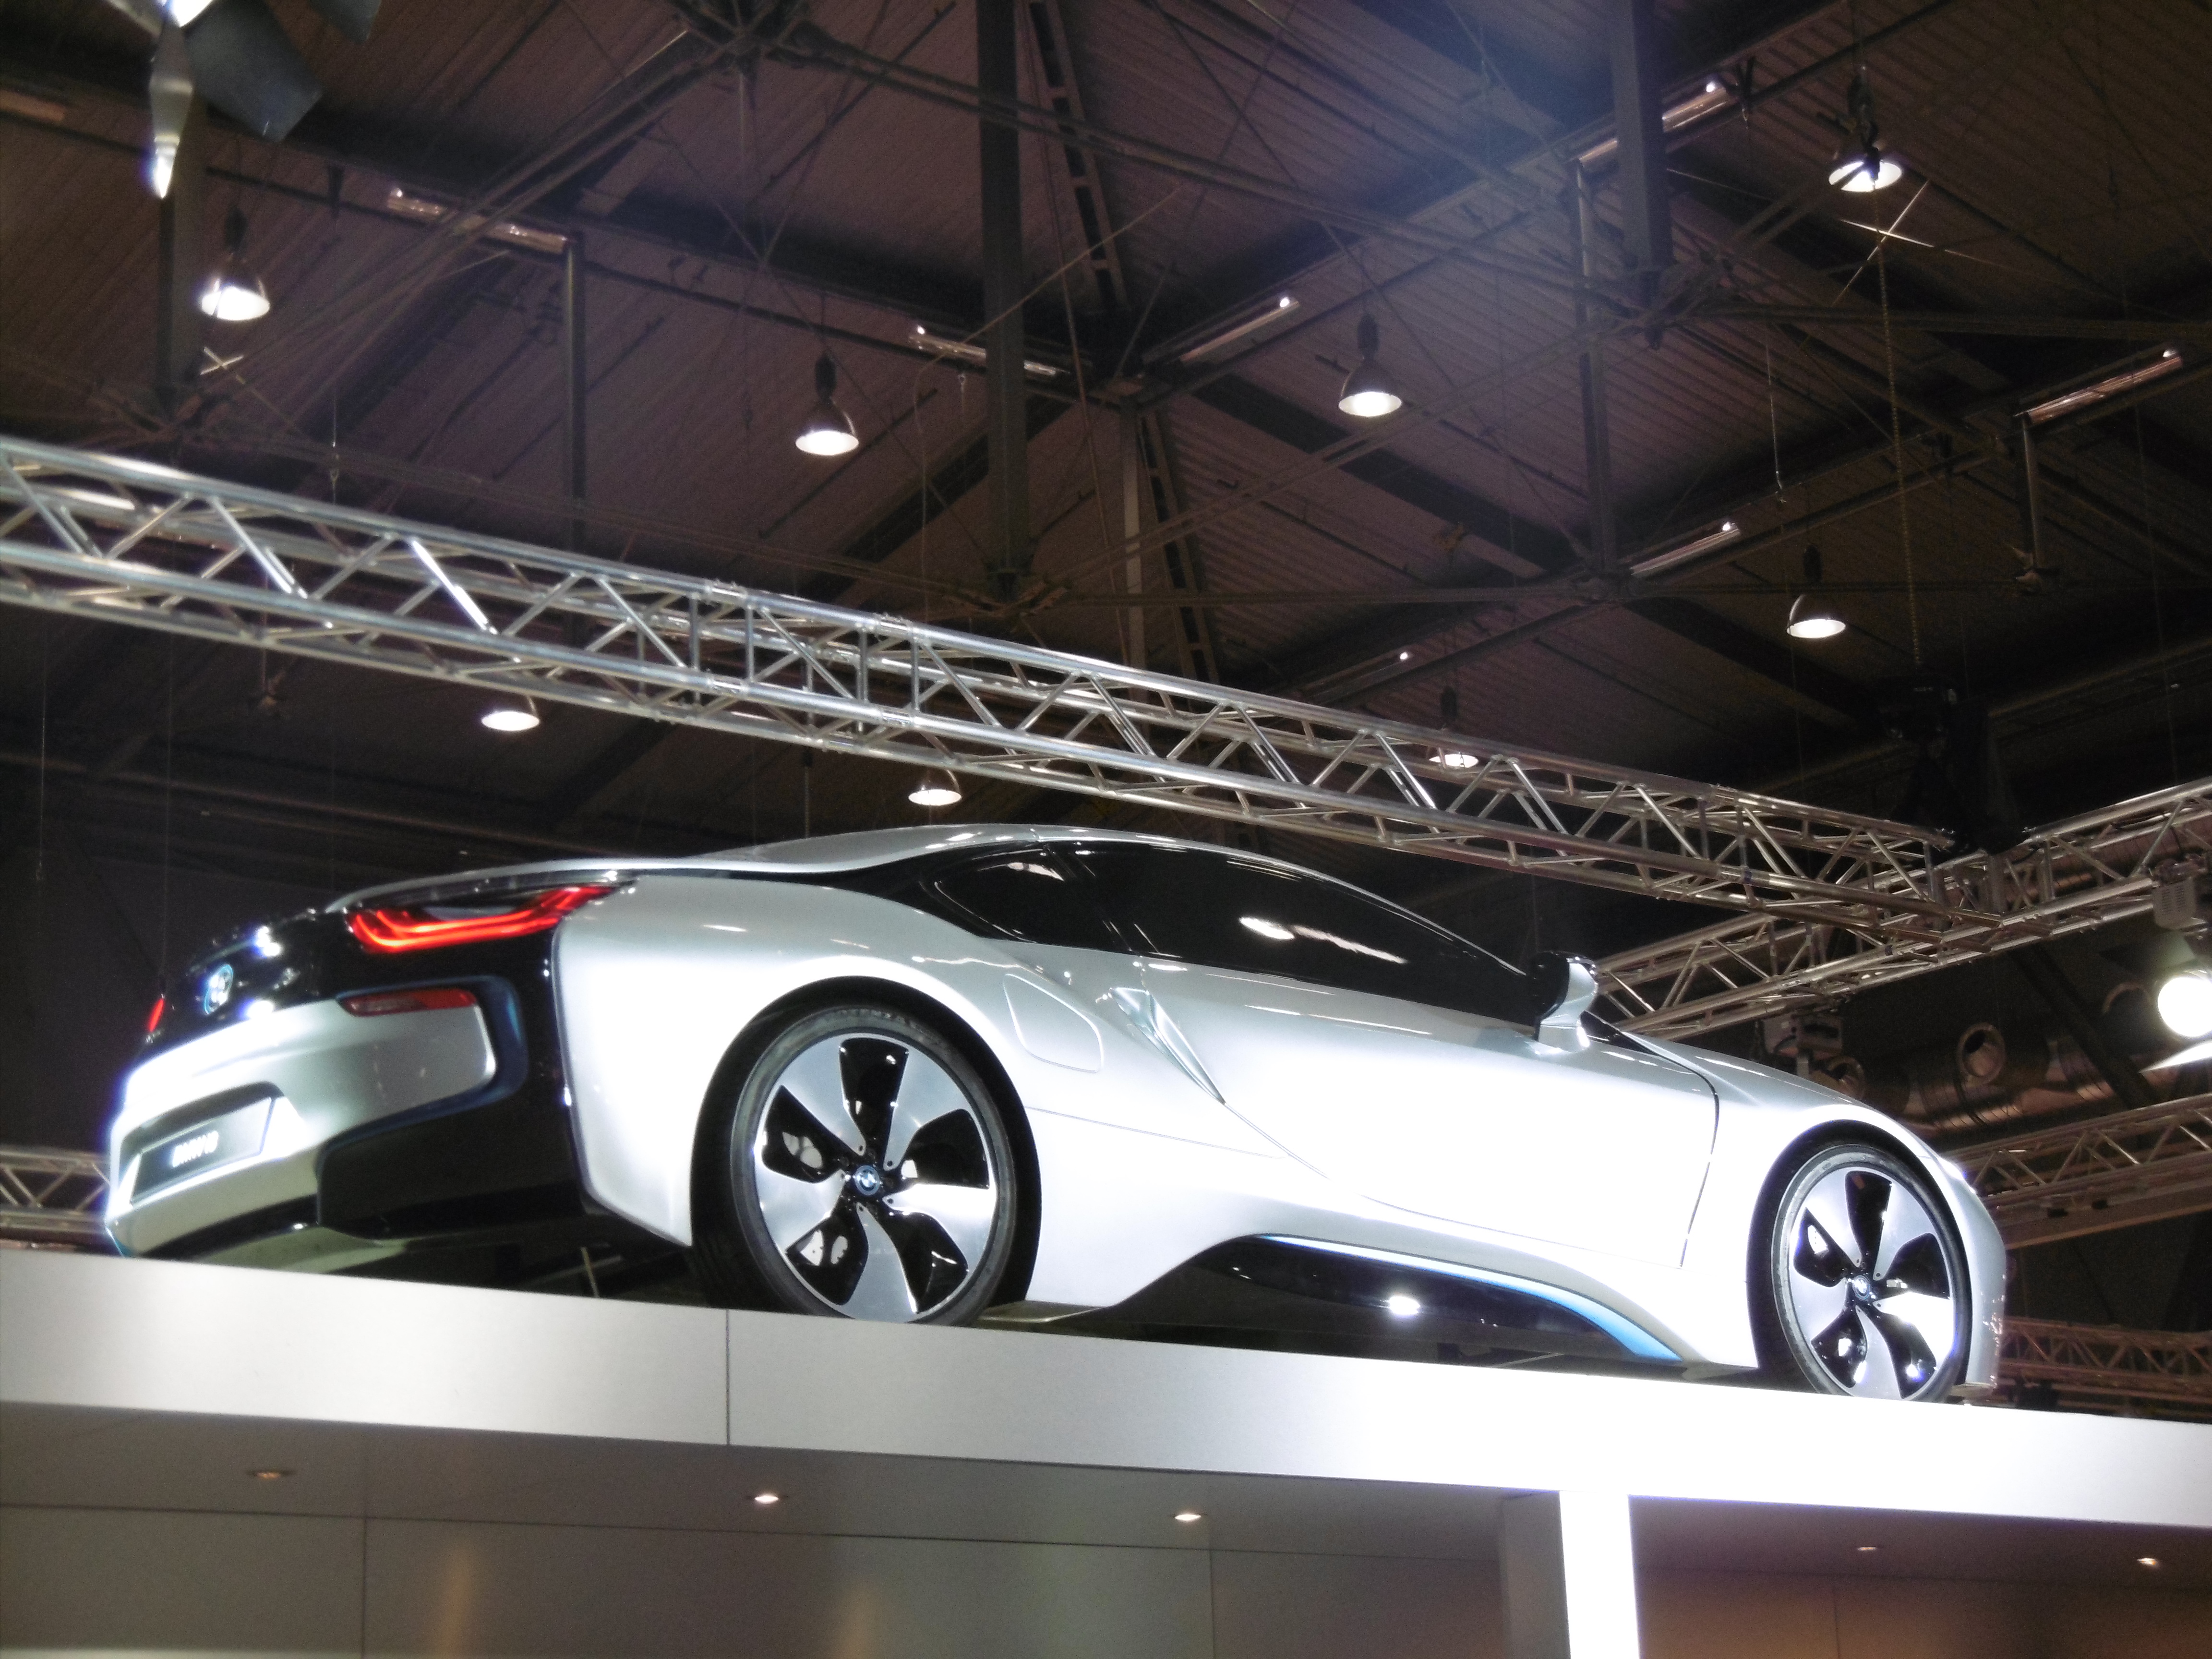
i8¹ (2018)
source:
Wikipedia
by Dispvas2018
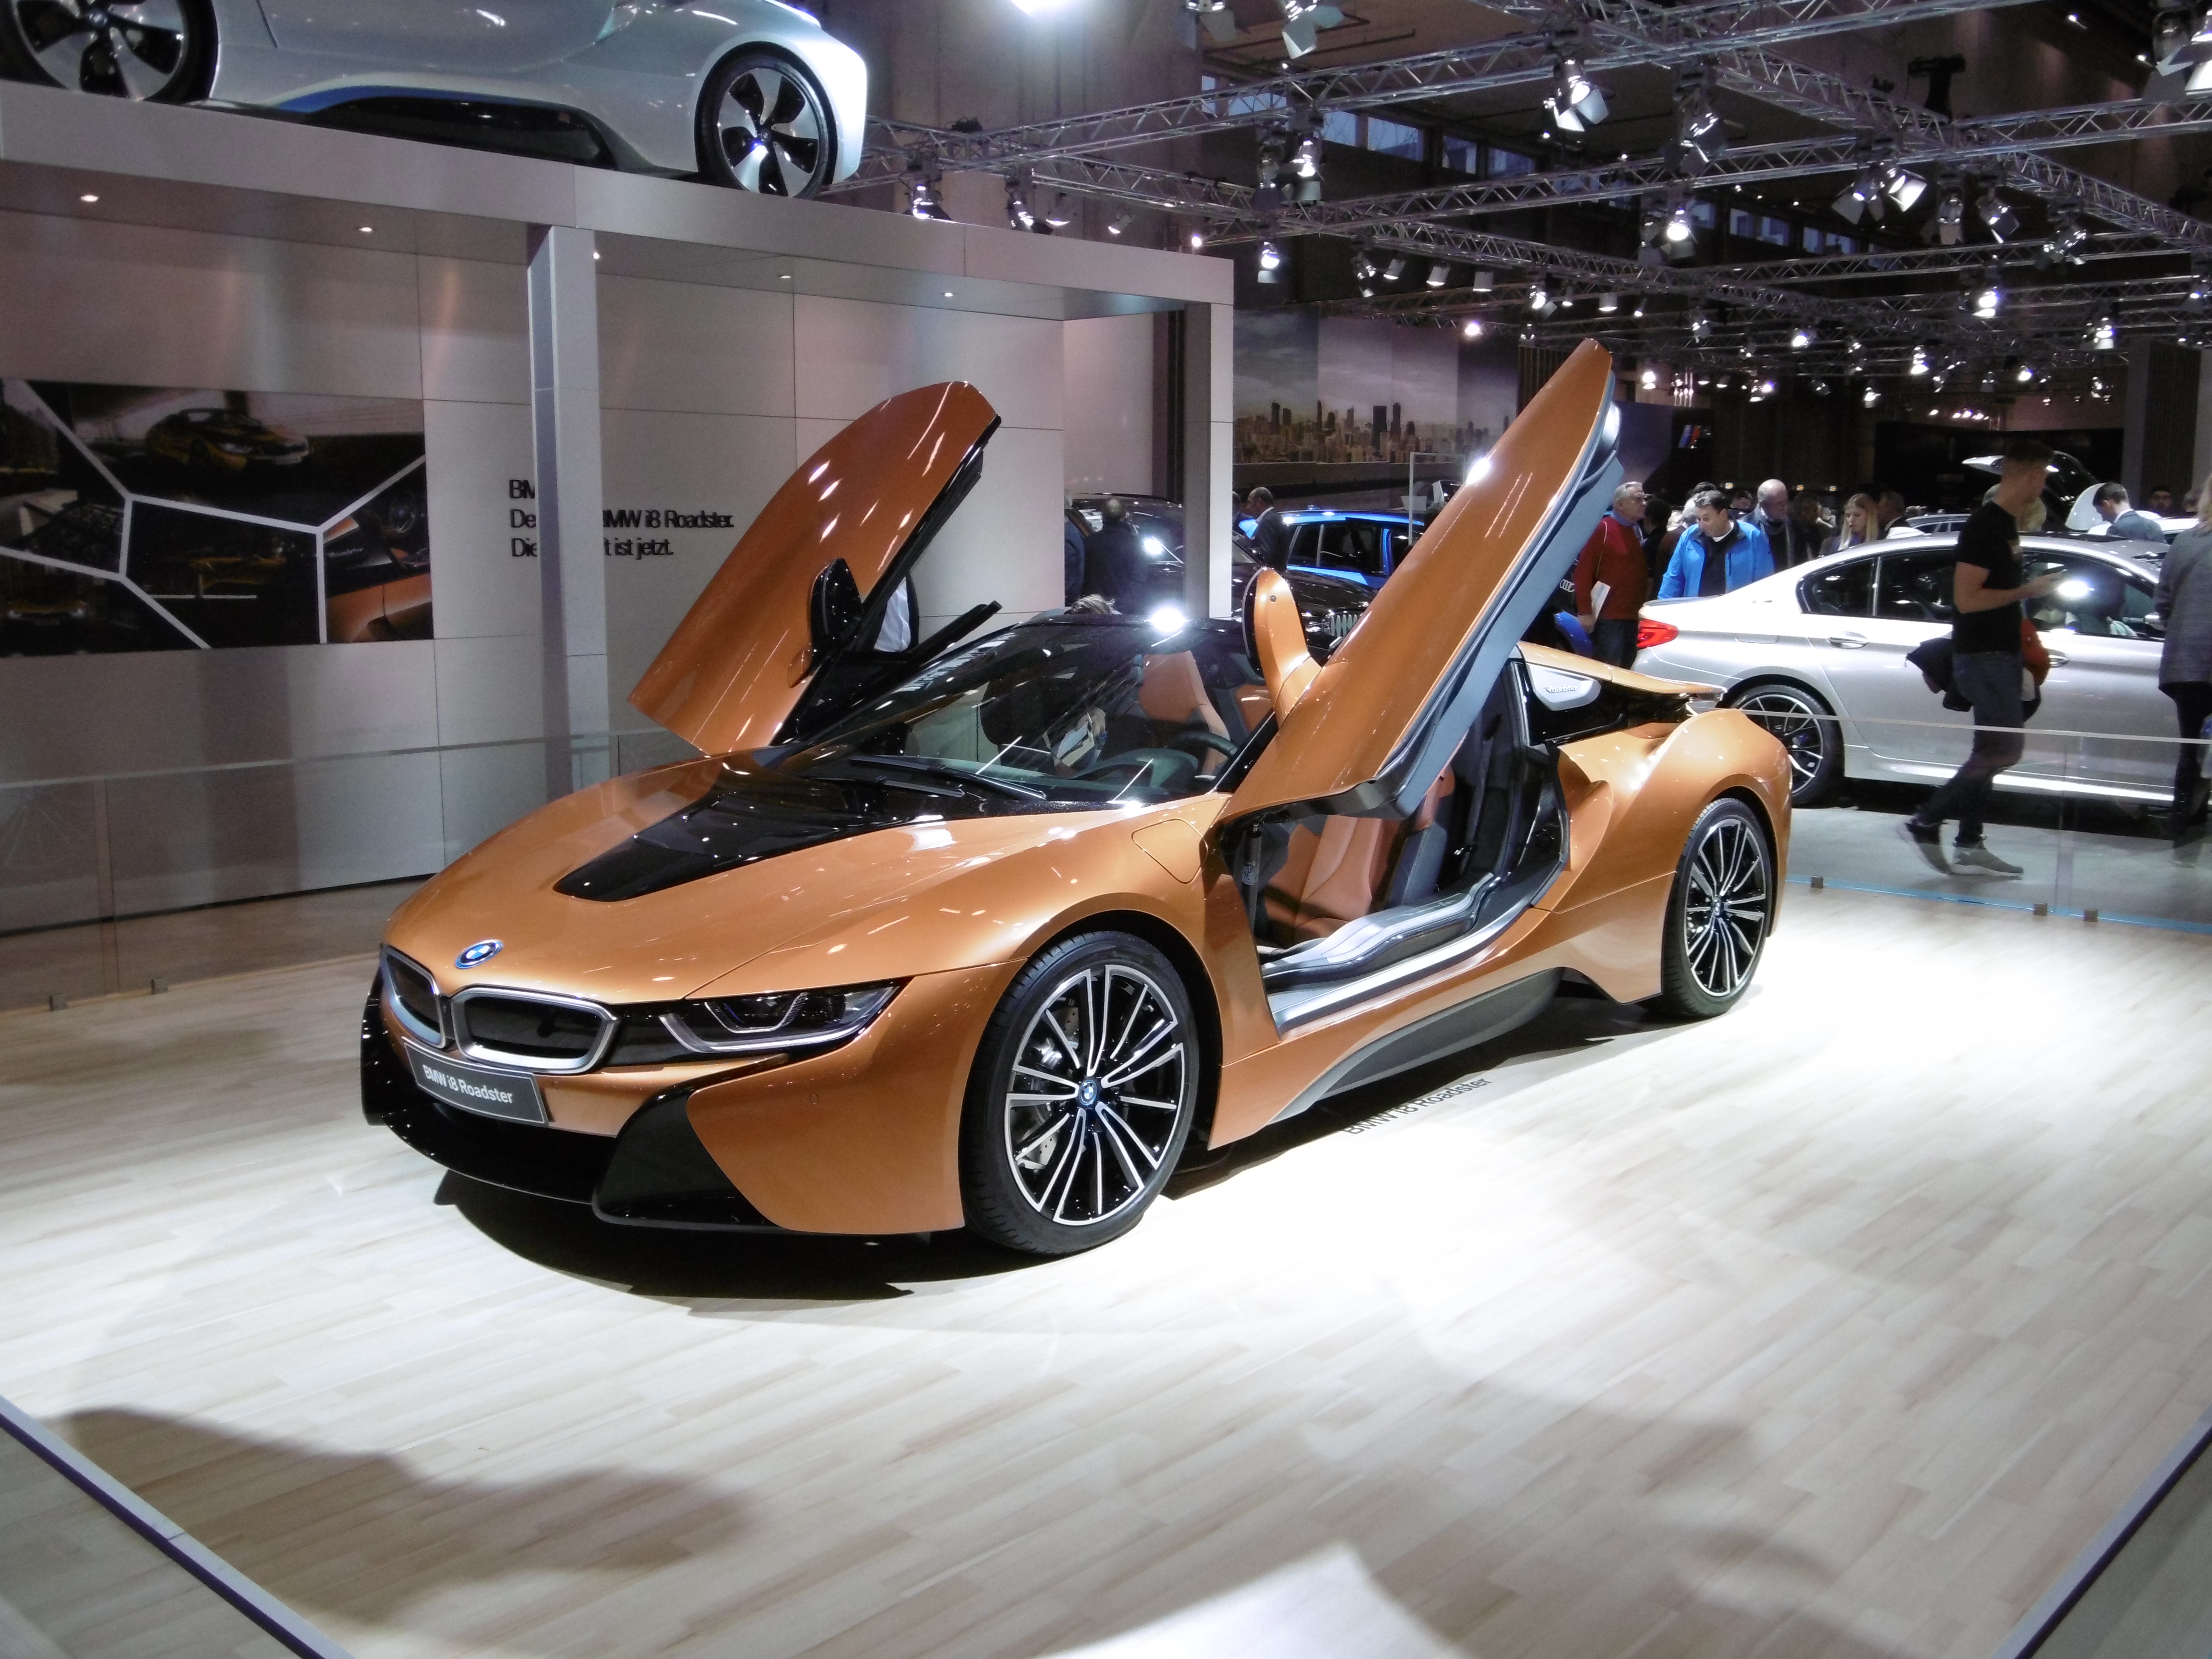
i8 Roadster¹ (2018)
source:
Wikipedia
by Dispvas2018
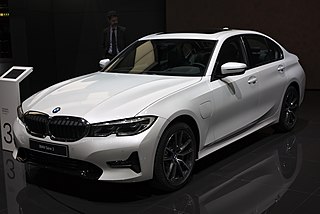
330e¹ (2019)
source:
Wikipedia
by Alexander Migl
i3 60Ah BEV° (2014)
source:
Wikipedia
by TTTNIS
i3 60Ah REX¹° (2014)
source:
Wikipedia
by TTTNIS
i3s 94Ah BEV° (2018)
source:
Wikipedia
by Vauxford
i3s 94Ah REX¹° (2018)
source:
Wikipedia
by Vauxford
i3 94Ah BEV° (2016)
source:
Wikipedia
by TTTNIS
i3 94Ah REX¹° (2016)
source:
Wikipedia
by TTTNIS
i8¹° (2014)
source:
Wikipedia
by youkeys
iX3²° (2021)
source:
Wikipedia
by Alexander Migl
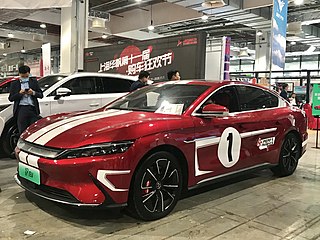
BYD
Atto 3² (2023)
source:
Wikipedia
by Chanokchon
Dophin (EA1) Active² (2023)
source:
Wikipedia
by JustAnotherCarDesigner
Dophin (EA1) Boost² (2023)
source:
Wikipedia
by JustAnotherCarDesigner
Dophin (EA1) Comfort² (2023)
source:
Wikipedia
by JustAnotherCarDesigner
Dophin (EA1) Design² (2023)
source:
Wikipedia
by JustAnotherCarDesigner
e5² (2017)
source:
Wikipedia
by DKMcLaren
e6 (2017)
source:
Wikipedia
by Navigator84
Han AWD² (2020)
source:
Wikipedia
by Jengtingchen
Han RWD² (2020)
source:
Wikipedia
by Jengtingchen
Denza (2018)
source:
Wikipedia
by Navigator84
Seal² (2023)
source:
Wikipedia
by Evnerd
Seal Long Range² (2023)
source:
Wikipedia
by Evnerd
Song EV300² (2018)
source:
Wikipedia
by Jengtingchen
Song EV400² (2018)
source:
Wikipedia
by Jengtingchen
Tang AWD² (2021)
source:
Wikipedia
by Jengtingchen
Tang RWD² (2021)
source:
Wikipedia
by Jengtingchen
Qin pro EV² (2018)
source:
Wikipedia
by Navigator84
Yuan EV360² (2018)
source:
Wikipedia
by Jengtingchen
Dophin (EA1) Base° (2021)
source:
Wikipedia
by JustAnotherCarDesigner
Dophin (EA1) Mid° (2021)
source:
Wikipedia
by JustAnotherCarDesigner
e6° (2010)
source:
Wikipedia
by anthonares
Byton
M-Byte - 70kWh²° (2021)
source:
Wikipedia
by Jengtingchen
M-Byte - 95kWh²° (2021)
source:
Wikipedia
by Jengtingchen
K-Byte - 70kWh²° (2022)
source:
Wikipedia
by Jengtingchen
K-Byte - 95kWh²° (2022)
source:
Wikipedia
by Jengtingchen
Chevrolet
Bolt (2020)
source:
Wikipedia
by Mariordo
Spark EV (2016)
source:
Wikipedia
by S 400 HYBRID
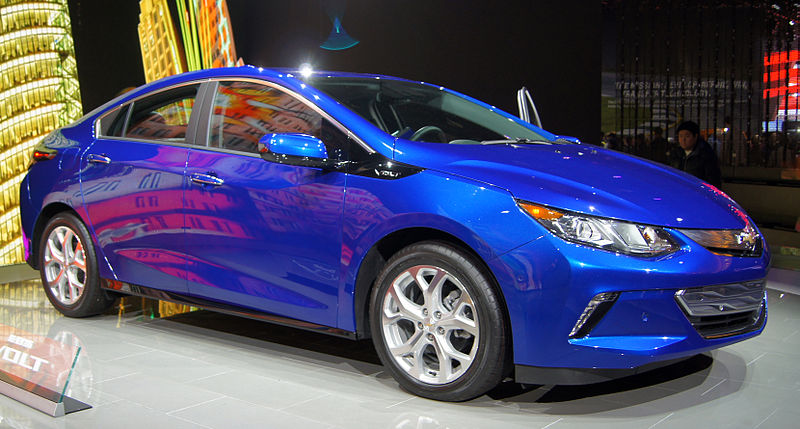
Volt¹ (2015)
source:
Wikipedia
by Mariordo
Bolt° (2017)
source:
Wikipedia
by Mariordo
Volt¹° (2013)
source:
Wikipedia
by PD-USGov
Volt¹° (2011)
source:
Wikipedia
by PD-USGov
Citroen
Berlingo Electric (2015)
source:
Wikipedia
by Own work
DS 3 Crossback E-Tense² (2020)
source:
Wikipedia
by Alexander Migl
C-Zero (2015)
source:
Wikipedia
by Thomas Doerfer
e-C4 (2021)
source:
Wikipedia
by M93
e-Spacetourer 50kW² (2020)
source:
Wikipedia
by Own work
e-Spacetourer 75kW² (2020)
source:
Wikipedia
by Own work
Jumpy 50kW² (2020)
source:
Wikipedia
by Vauxford
Jumpy 75kW² (2020)
source:
Wikipedia
by Vauxford
Cupra
Born 77 e-boost² (2022)
source:
Wikipedia
by Matti Blume
Born 58 e-boost² (2021)
source:
Wikipedia
by Matti Blume
Born 58² (2021)
source:
Wikipedia
by Matti Blume
Born 45² (2021)
source:
Wikipedia
by Matti Blume
DFSK
Seres 3 (2020)
source:
DFSK
Dacia
Spring² (2021)
source:
motor1
by Dacia
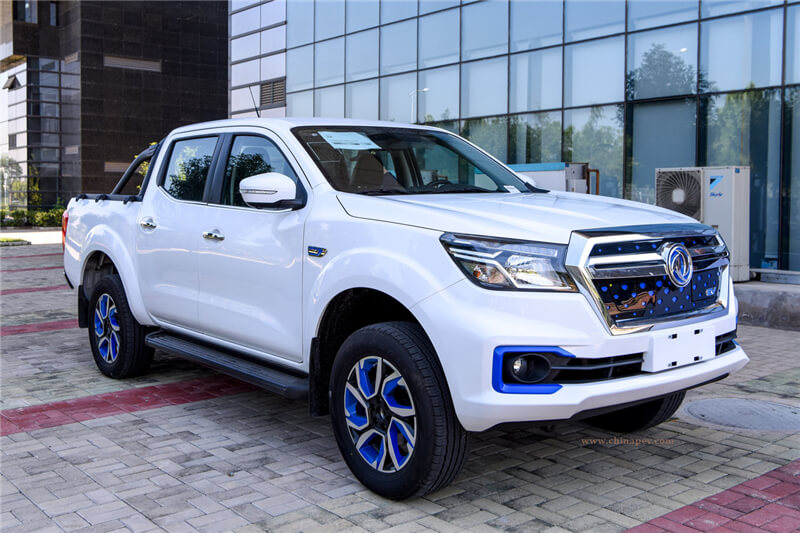
Dongfeng
Rich 6 EV (2019)
source:
ChinaCarNews
Electra
Solo (2022)
source:
Wikipedia
by Jennaemv
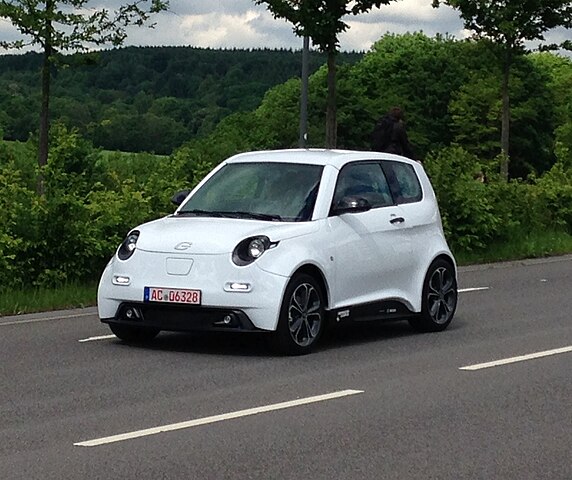
e.Go
Life 60² (2019)
source:
Wikipedia
by DTMChampion
Life 40² (2020)
source:
Wikipedia
by DTMChampion
Life 20² (2019)
source:
Wikipedia
by DTMChampion
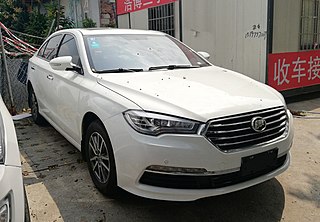
FAW
Senia R7 EV² (2019)
source:
WattEV2Buy
Besturn B30 EV (2017)
source:
WattEV2Buy
Besturn X40 EV (2018)
source:
WattEV2Buy
Fiat
500e (24kWh)² (2020)
source:
Wikipedia
by Lanciatype840
500e (42kWh)² (2020)
source:
Wikipedia
by Lanciatype840
Doblo Micro-Vett (2015)
source:
Wikipedia
by Flyz1
Fiorino Micro-Vett (2015)
source:
Wikipedia
by Spielvogel
500e° (2013)
source:
Wikipedia
by Rudolf Stricker
Fisker
Ocean Sport² (2023)
source:
Wikipedia
by MrWalkr
Ocean One² (2023)
source:
Wikipedia
by MrWalkr
Ocean Ultra² (2023)
source:
Wikipedia
by MrWalkr
Ocean Extrene² (2023)
source:
Wikipedia
by MrWalkr
Ford
Mustang Mach-E 1st Edition² (2020)
source:
Wikipedia
by Craig James
Mustang Mach-E Premium² (2020)
source:
Wikipedia
by Craig James
Mustang Mach-E Select² (2021)
source:
Wikipedia
by Craig James
Mustang Mach-E GT² (2021)
source:
Wikipedia
by Craig James
Focus Electric (2017)
source:
Wikipedia
by Mariordo
Focus Electric² (2015)
source:
Wikipedia
by Mariordo
Genesis
GV60 (2022)
source:
Wikipedia
by Damian B Oh
G80 (2022)
source:
Wikipedia
by Damian B Oh
Geely
Emgrand EV300² (2018)
source:
Wikipedia
by KotVadim
Emgrand EV450² (2018)
source:
Wikipedia
by KotVadim
Emgrand GSe² (2018)
source:
Wikipedia
by Jengtingchen
GE11 EV² - 52kWh (2019)
source:
ChinaPEV
GE11 EV² - 62kWh (2019)
source:
ChinaPEV
GMC
Hummer EV Ed.1² (2022)
source:
Wikipedia
by HJUdall
Honda
e² (2020)
source:
Wikipedia
by Matti Blume
Clarity Electric² (2018)
source:
Wikipedia
by Lcaa9
Hyundai
Ioniq 6 Long Range 4WD² (2023)
source:
Wikipedia
by Damian B Oh
Ioniq 6 ² (2023)
source:
Wikipedia
by Damian B Oh
Ioniq 5 - 58kWh (2021)
source:
Wikipedia
by Alexander Migl
Ioniq 5 - 73kWh (2021)
source:
Wikipedia
by Alexander Migl
Ioniq EV (2020)
source:
electrek
Kona EV - 65kWh (2023)
source:
Wikipedia
by Damian B Oh
Kona EV - 48kWh (2023)
source:
Wikipedia
by Damian B Oh
Kona EV - 64kWh° (2021)
source:
GoingElectric
Kona EV - 40kWh° (2021)
source:
GoingElectric
Kona EV - 64kWh° (2020)
source:
Wikipedia
by Alexander Migl
Kona EV - 40kWh° (2019)
source:
Wikipedia
by Alexander Migl
Kona EV - 64kWh° (2018)
source:
Wikipedia
by Alexander Migl
Ioniq EV° (2016)
source:
Wikipedia
by M 93
Ioniq Plug-In° (2016)
source:
Wikipedia
by Pablo Montoya
JAC Motors
e-S2² (2020)
source:
Wikipedia
by Jengtingchen
iEVA50² (2018)
source:
Wikipedia
by Jengtingchen
iEV6E² (2018)
source:
Wikipedia
by Kevauto
iEV7S² (2018)
source:
Wikipedia
by Jengtingchen
Jaguar
I-Pace² (2018)
source:
Wikipedia
by Alexander Migl
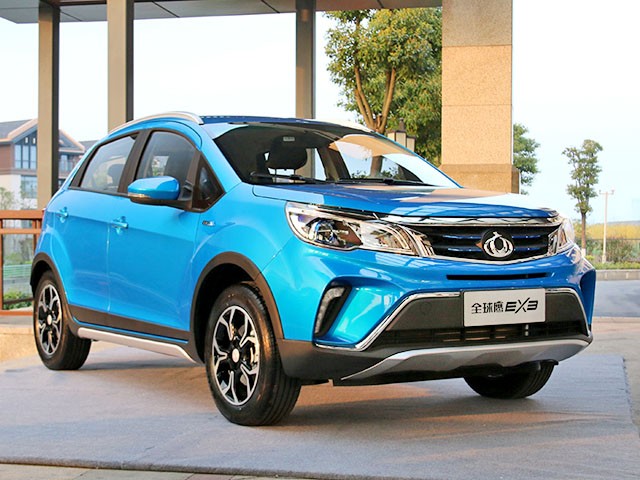
Kandi
EX3² (2018)
source:
ChinaCarForum
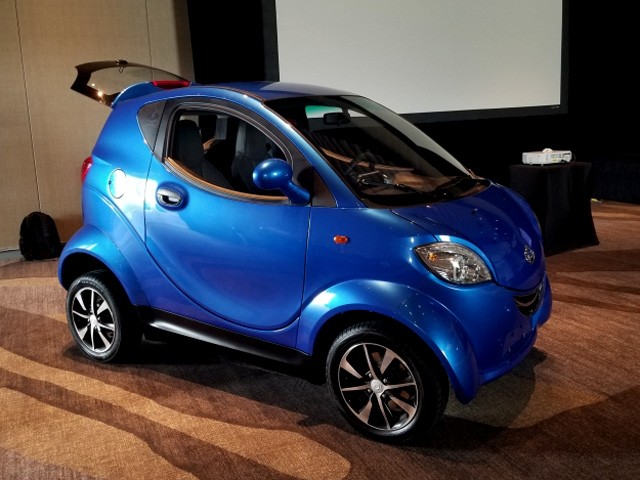
K22² (2018)
source:
ChinaCarForum
Kia
EV6 RWD - Long Range² (2021)
source:
Kia
EV6 AWD - Long Range² (2021)
source:
Kia
e-Niro (2019)
source:
Wikipedia
by Flyz1
e-Niro Long Range (2020)
source:
Wikipedia
by Flyz1
Niro PHEV (2017)
source:
Wikipedia
by Alexander Migl
Soul EV² (2019)
source:
Wikipedia
by Matti Blume
Soul EV Long Range² (2019)
source:
Wikipedia
by Matti Blume
e-Niro Long Range° (2018)
source:
Wikipedia
by Flyz1
Soul EV° (2017)
source:
Wikipedia
by Norbert Aepli
Soul EV° (2012)
source:
Wikipedia
by Norbert Aepli
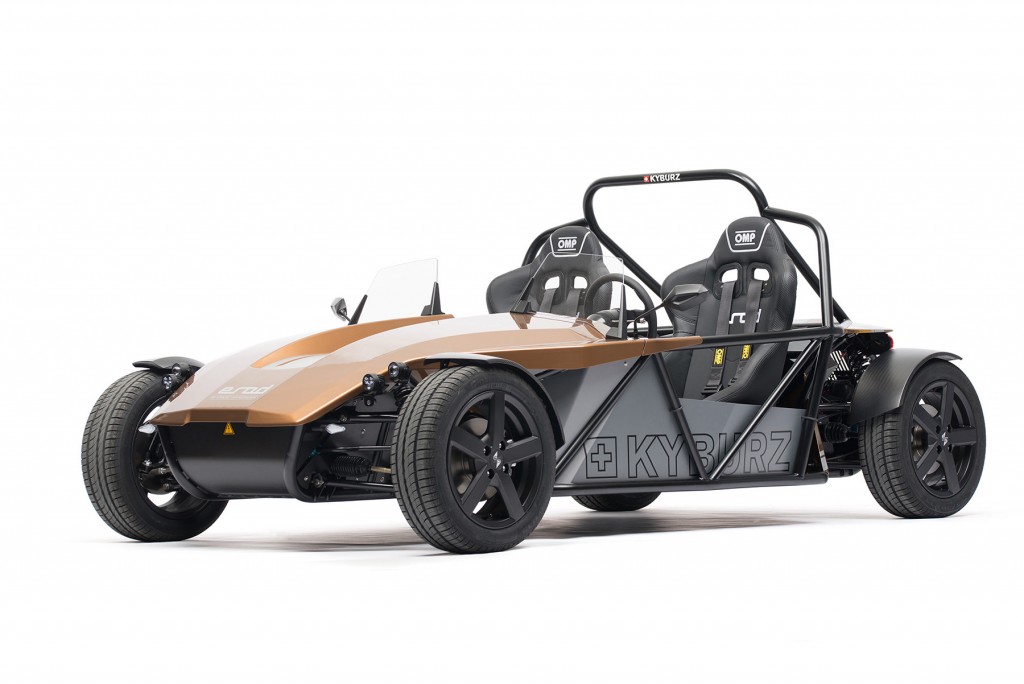
Kyburz
eRod Fun (2020)
source:
Kyburz
Plus2 - 2.5kWh (2020)
source:
Kyburz
Plus2 - 5kWh (2020)
source:
Kyburz
Plus2 Streamline - 5kWh (2020)
source:
Kyburz
Plus2 - 10kWh (2020)
source:
Kyburz
Plus2 Streamline - 10kWh (2020)
source:
Kyburz
MaXX (2020)
source:
Kyburz
DX2 - 2.5kwWh (2020)
source:
Kyburz
DX2 - 4.6kwWh (2020)
source:
Kyburz
DX2 - 5.1kwWh (2020)
source:
Kyburz
DXS 4.x - 4.6kWh (2020)
source:
Kyburz
DXS 4.x - 5.1kWh (2020)
source:
Kyburz
DXS 5.x - 4.6kWh (2020)
source:
Kyburz
DXS 5.x - 5.1kWh (2020)
source:
Kyburz
DXS 5.x - 6.2kWh (2020)
source:
Kyburz
DXP - 6.2kWh (2020)
source:
Kyburz
DXPi - 5.2kWh (2020)
source:
Kyburz
DXPi - 10.4kWh (2020)
source:
Kyburz
DXPCargo - 5.2kWh (2020)
source:
Kyburz
DXPCargo - 10.4kWh (2020)
source:
Kyburz
Leap Motor
S01² - 36kWh (2019)
source:
Wikipedia
by Jengtingchen
S01² - 48kWh (2019)
source:
Wikipedia
by Jengtingchen
Lexus
UX 300e (2020)
source:
Wikipedia
by Vauxford
Lifan Motors
820EV (2018)
source:
Wikipedia
by Navigator84
650EV (2018)
source:
Lifan Motors
Lightyear
One² (2022)
source:
Wikipedia
by Lightyear01
Lotus
Eletre² (2023)
source:
Wikipedia
by MrWalkr
Lucid
Air - Dream Edition² (2021)
source:
Wikipedia
by Phillip Pessa
Air - Dream Edition Performance² (2022)
source:
Wikipedia
by Phillip Pessa
Air - Grand Touring² (2021)
source:
Wikipedia
by Phillip Pessa
Air - Touring² (2021)
source:
Wikipedia
by Phillip Pessa
Air² (2022)
source:
Wikipedia
by Phillip Pessa
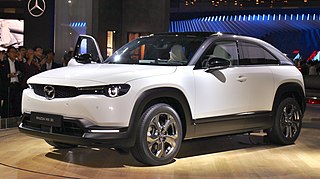
Mazda
MX-30² (2020)
source:
Wikipedia
by TTTNIS
Mercedes
Vision EQXX² (2022)
source:
3Druck
EQA 250 plus (2022)
source:
Wikipedia
by Liam Walker
EQA 250 (2021)
source:
Wikipedia
by Liam Walker
EQA 300² (2021)
source:
Wikipedia
by Liam Walker
EQA 350² (2021)
source:
Wikipedia
by Liam Walker
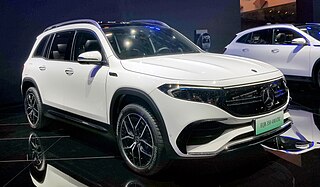
EQB 250 plus (2023)
source:
Wikipedia
by JustAnotherCarDesigner
EQB 350 4matic² (2022)
source:
Wikipedia
by JustAnotherCarDesigner
EQC 350 4matic (2020)
source:
Wikipedia
by Matti Blume
EQC 400 4matic - AMG Line (2020)
source:
Wikipedia
by Matti Blume
EQC 400 4matic (2019)
source:
Wikipedia
by Matti Blume
EQE 350² (2022)
source:
Wikipedia
by Alexander Migl
EQE 500 4matic² (2022)
source:
Wikipedia
by Alexander Migl
EQV 300² (2020)
source:
Wikipedia
by Alexander Migl
EQS 580 4MATIC² (2021)
source:
Wikipedia
by Alexander Migl
EQS 450² (2021)
source:
Wikipedia
by Alexander Migl
eSprinter² - 41kWh (2018)
source:
Wikipedia
by EurovisionNim
eSprinter² - 55kWh (2018)
source:
Wikipedia
by EurovisionNim
eVito (2018)
source:
Wikipedia
by Thomas Doerfer
B Electric Drive° (2014)
source:
Wikipedia
by M 93
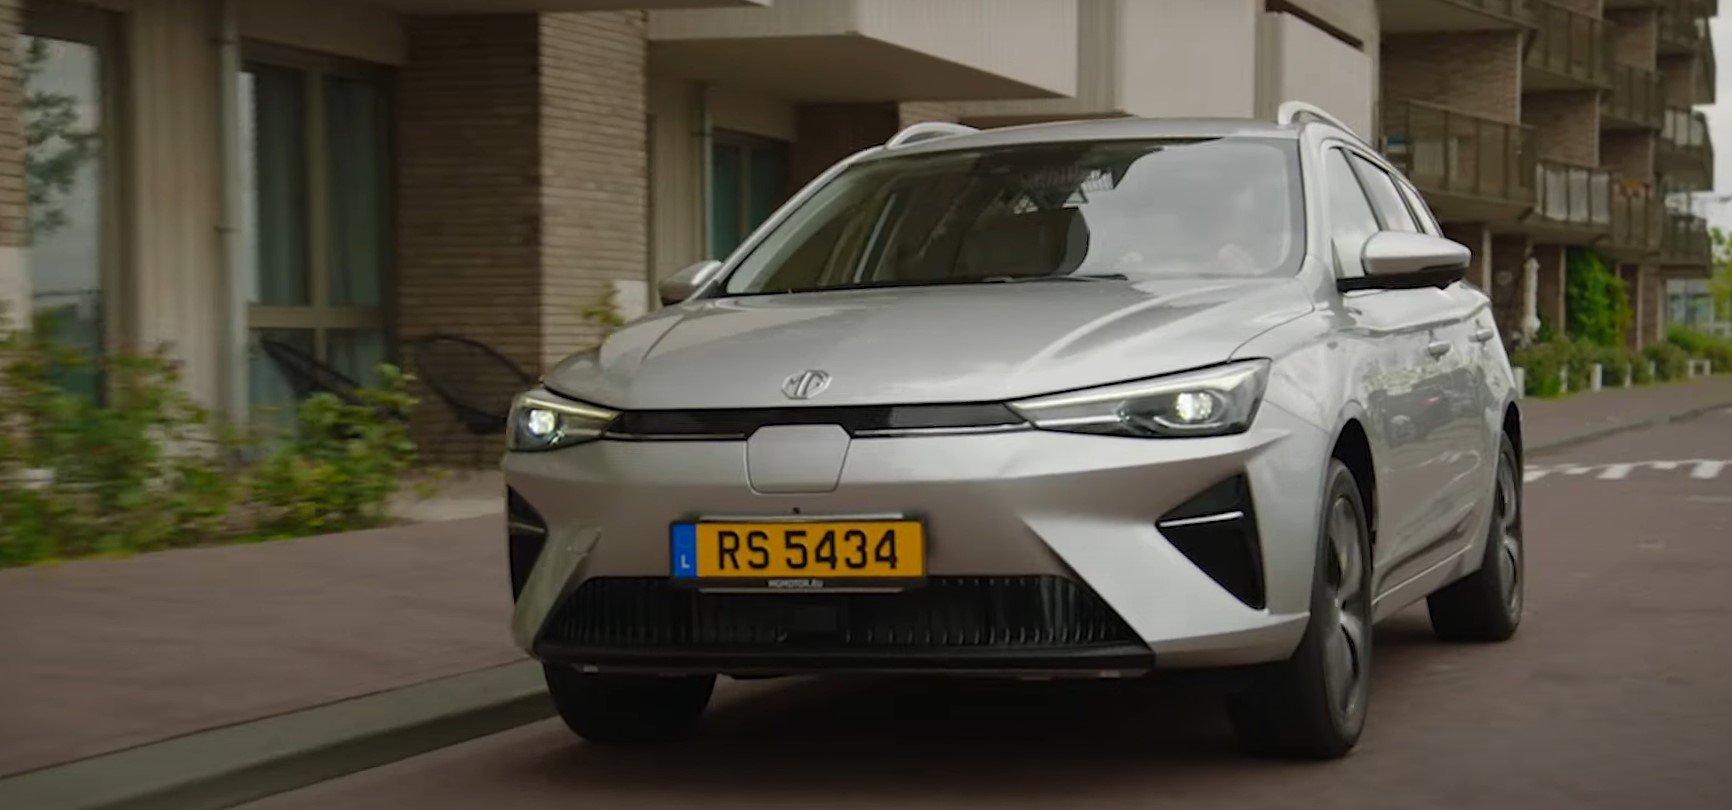
MG
source:
Wikipedia
by Alexander Migl
source:
Wikipedia
by Alexander Migl
source:
tff-forum
source:
tff-forum
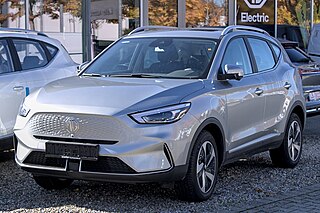
ZS EV Long Range² (2022)
source:
Wikipedia
by Alexander Migl
ZS EV Standard Range² (2022)
source:
Wikipedia
by Alexander Migl
ZS EV (2019)
source:
Wikipedia
by Navigator84
M-cro
Microlino - 8kWh (2019)
source:
Wikipedia
by Alexander Migl
Microlino - 14kWh (2019)
source:
Wikipedia
by Alexander Migl
Mini
Cooper SE² (2020)
source:
Wikipedia
by Alexander Migl
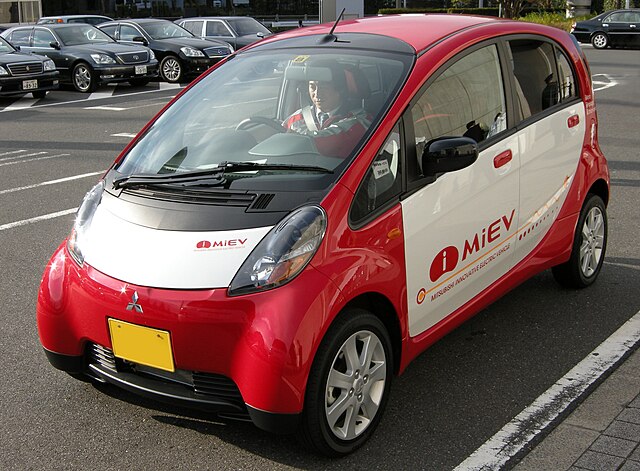
Mitsubishi
i-MiEV (2015)
source:
Wikipedia
by Hatsukari715
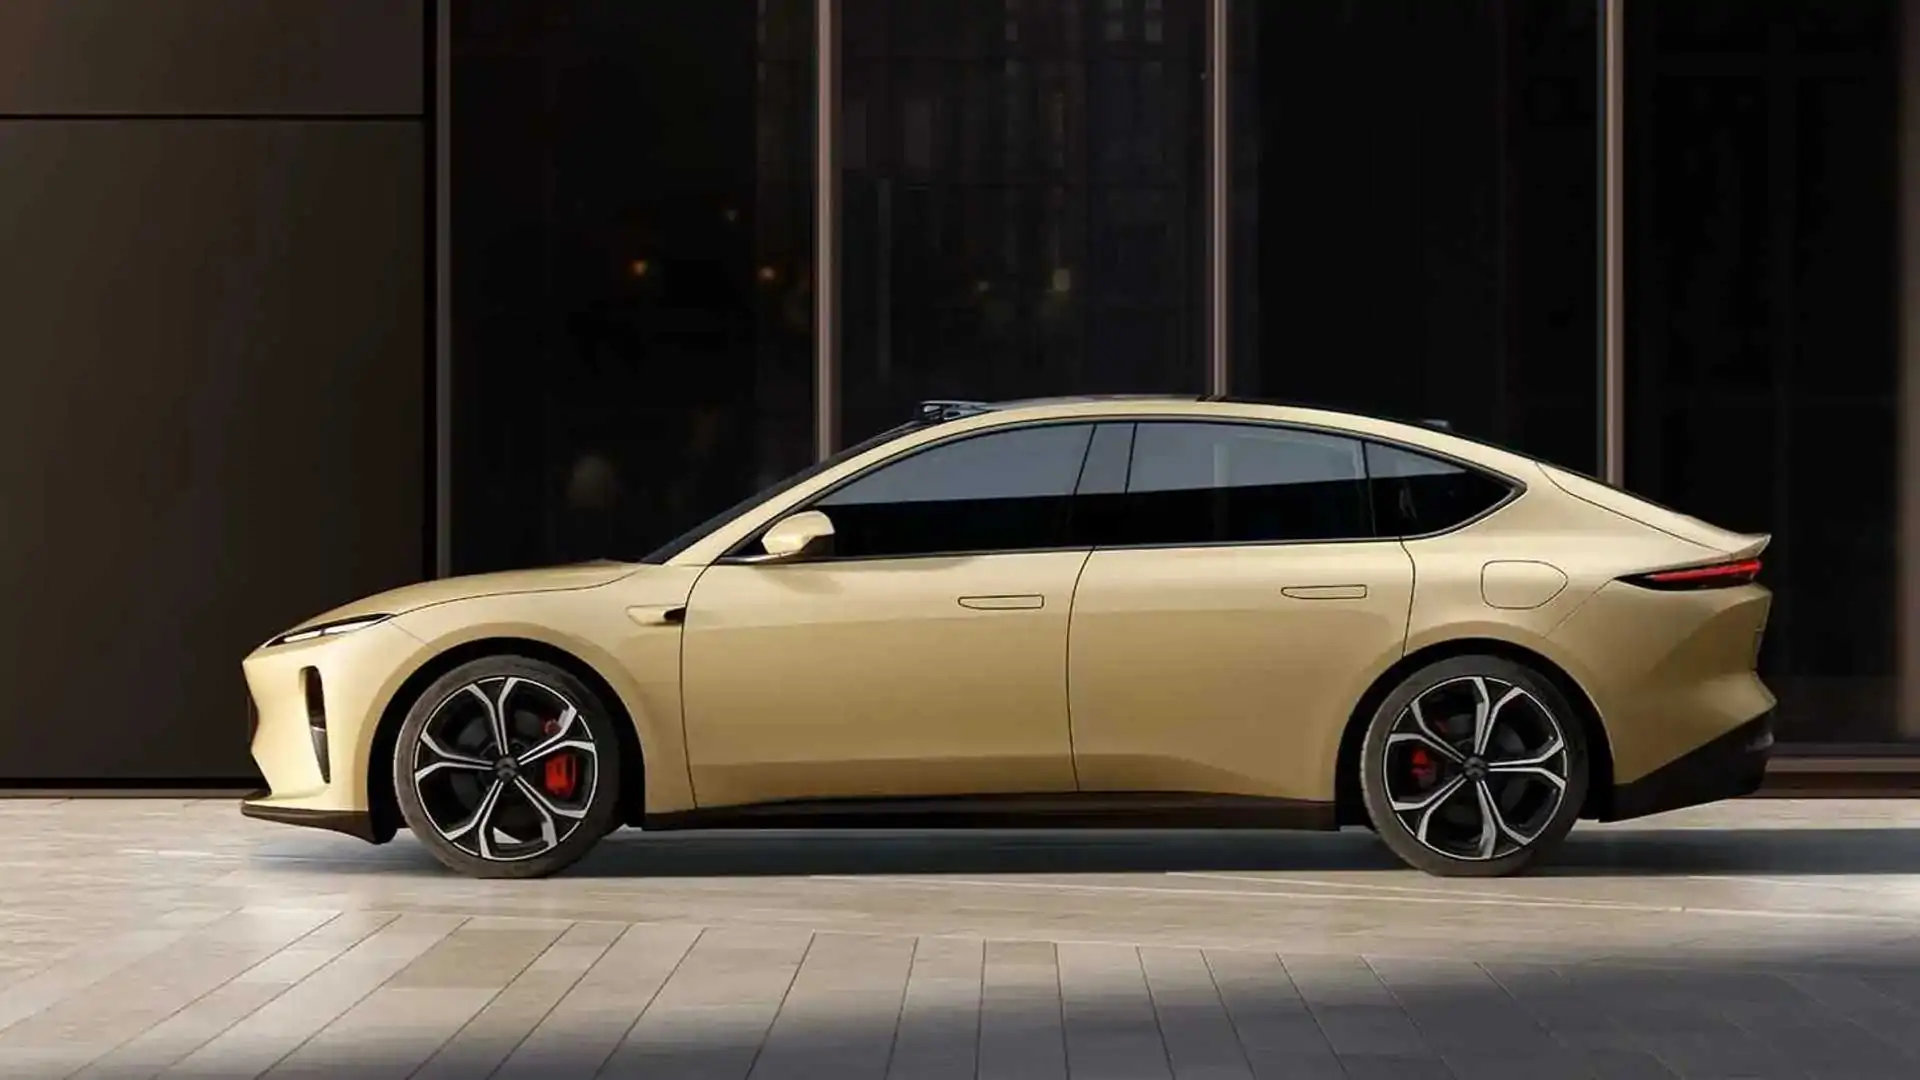
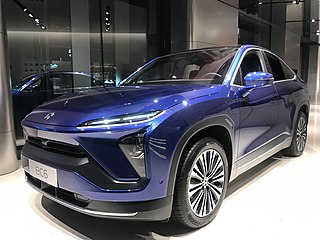
Nio
EL7 - 100kWh² (2023)
source:
Wikipedia
by Zotyefan
ET5 - 75kWh² (2023)
source:
Wikipedia
by Zotyefan
ET5 - 150kWh² (2022)
source:
InsideEVs
ET5 - 100kWh² (2022)
source:
InsideEVs
ET5 - 75kWh² (2022)
source:
InsideEVs
EC6 - 100kWh² (2020)
source:
Wikipedia
by Jengtingchen
EC6 - 70kWh² (2020)
source:
Wikipedia
by Jengtingchen
ES6 - 84kWh² (2019)
source:
Wikipedia
by Jengtingchen
ES6 - 70kWh² (2019)
source:
Wikipedia
by Jengtingchen
ES8 - 70kWh² (2018)
source:
Wikipedia
by Jengtingchen
ET7 - 150kWh² (2022)
source:
Wikipedia
by Jengtingchen
ET7 - 100kWh² (2021)
source:
Wikipedia
by Jengtingchen
ET7 - 70kWh² (2021)
source:
Wikipedia
by Jengtingchen
Nissan
Ariya (AWD) - 90kWh² (2021)
source:
Wikipedia
by TTTNIS
Ariya (2WD) - 65kWh² (2021)
source:
Wikipedia
by TTTNIS
e-NV200 Combi - 24kWh (2017)
source:
Wikipedia
by Kārlis Dambrāns
e-NV200 Combi - 40kWh (2017)
source:
Wikipedia
by Kārlis Dambrāns
e-NV200 Van - 24kWh (2017)
source:
Wikipedia
by Mr.choppers
e-NV200 Van - 40kWh (2017)
source:
Wikipedia
by Mr.choppers
Leaf 3.0 e-plus (2019)
source: Photo by Ch. Karatsonyi
Leaf 3.0 (2019)
source: Photo by Ch. Karatsonyi
Leaf 2.0° (2018)
source: Photo by Ch. Karatsonyi
Leaf° (2015)
source:
Wikipedia
by M 93
Leaf° (2013)
source:
Wikipedia
by M 93
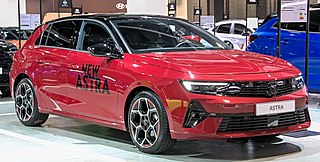
Opel
Ampera-e (2017)
source:
Wikipedia
by Thesupermat
Astra Electric² (2023)
source:
Wikipedia
by Alexander Migl
Astra Tourer Electric² (2023)
source:
Wikipedia
by Alexander Migl
Corsa-e² (2020)
source:
Wikipedia
by Alexander Migl
Mokka-e² (2021)
source:
Wikipedia
by DanielPrzygoda
Zafira-e 50kW² (2021)
source:
Wikipedia
by Alexander Migl
Zafira-e 75kW² (2021)
source:
Wikipedia
by Alexander Migl
Vivaro-e 50kW² (2020)
source:
Wikipedia
by Alexander Migl
Vivaro-e 75kW² (2020)
source:
Wikipedia
by Alexander Migl
Ampera¹° (2015)
source:
Wikipedia
by M 93
ORA
Funky Cat 400² (2023)
source:
Wikipedia
by Evnerd
Funky Cat 300² (2023)
source:
Wikipedia
by Evnerd
Peraves
MonoTracer E° (2014)
source: Photo by R. Riedener
Peugeot
e-2008 GT² (2020)
source:
Wikipedia
by Alexander Migl
e-208 (2020)
source:
Wikipedia
by Alexander Migl
e-Expert 50kW² (2020)
source:
Wikipedia
by Vauxford
e-Expert 75kW² (2020)
source:
Wikipedia
by Vauxford
iON (2015)
source:
Wikipedia
by M 93
Polestar
2 (2020)
source:
Wikipedia
by Alexander Migl
3 (2023)
source:
ev-database
Porsche
Taycan 4S Cross Turismo (2021)
source:
Wikipedia
by Noebu
Taycan Turbo Cross Turismo (2021)
source:
Wikipedia
by Noebu
Taycan Turbo S Cross Turismo (2021)
source:
Wikipedia
by Noebu
Taycan 4S (2020)
source:
Wikipedia
by Alexander Migl
Taycan 4S plus (2020)
source:
Wikipedia
by Alexander Migl
Taycan Turbo (2020)
source:
Wikipedia
by Alexander Migl
Taycan Turbo S (2020)
source:
Wikipedia
by Alexander Migl
Panamera 4 E-Hybrid° (2016)
source:
Wikipedia
Renault
City K-ZE² (2020)
source:
Wikipedia
by Jengtingchen
Megan eVision² (2021)
source:
Twitter
by autogazette
Kangoo Z.E.33 (2017)
source:
Wikipedia
by Rudolf Stricker
Kangoo Maxi Z.E.33 (2017)
source:
Wikipedia
by Norbert Aepli
Twizy (2011)
source:
Wikipedia
by Rama
Twingo Z.E. 22 (2020)
source:
Wikipedia
by Lothar Spurzem
Zoe Z.E.50 R135² (2019)
source:
Wikipedia
by Alexander Migl
Zoe Z.E.50 R110² (2019)
source:
Wikipedia
by Alexander Migl
Zoe Z.E.40 R110° (2019)
source:
Wikipedia
by Alexander Migl
Zoe Z.E.40 R110° (2018)
source:
Wikipedia
by Xabi Rome-Hérault
Zoe R90° (2017)
source: Photo by M. Schaller
Zoe Z.E.40 R90° (2017)
source: Photo by M. Schaller
Zoe Q90° (2017)
source: Photo by M. Schaller
Zoe Z.E.40 Q90° (2017)
source: Photo by M. Schaller
Zoe R240° (2015)
source: Photo by M. Schaller
Zoe R210° (2013)
source: Photo by M. Schaller
Zoe Q210° (2013)
source: Photo by M. Schaller
Kangoo Z.E.22° (2011)
source:
Wikipedia
by Rudolf Stricker
Kangoo Maxi Z.E.22° (2011)
source:
Wikipedia
by Norbert Aepli
Rivian
R1T LR² (2022)
source:
Wikipedia
by Kevauto
R1T² (2022)
source:
Wikipedia
by Kevauto
SAIC Motor
Marvel X AWD (2018)
source:
Wikipedia
by Jengtingchen
Marvel X RWD (2018)
source:
Wikipedia
by Jengtingchen
Maxus ev80 - 56kWh (2020)
source:
Wikipedia
by DeFacto
Maxus ev80 - 38kWh (2020)
source:
Wikipedia
by DeFacto
Roewe Ei5 (2019)
source:
Wikipedia
by Jengtingchen
Roewe eRX5 (2017)
source:
Wikipedia
by Jengtingchen
Seat
Mii Electric (2019)
source:
Wikipedia
by Thesupermat
Skoda
Citigo-E (2019)
source:
Wikipedia
by Noebu
Enyaq iV 50² (2021)
source:
Wikipedia
by Alexander Migl
Enyaq iV 60² (2021)
source:
Wikipedia
by Alexander Migl
Enyaq iV 80² (2021)
source:
Wikipedia
by Alexander Migl
Enyaq iV 80X² (2021)
source:
Wikipedia
by Alexander Migl
Enyaq iV RS² (2021)
source:
Wikipedia
by Alexander Migl
Smart
1² (2023)
source:
Wikipedia
by Alexander Migl
forFour EQ (2020)
source: Photo by eCalc
forTwo EQ (2020)
source: Photo by eCalc
forTwo EQ Cabrio (2017)
source:
Wikipedia
by M 93
forFour EQ° (2017)
source:
Wikipedia
by Vauxford
forTwo EQ° (2017)
source:
Wikipedia
by Norbert Aepli
forTwo ED° (2012)
source: Photo by A. Gornostayev
forTwo ED Cabrio° (2012)
source: Photo by J. Spangler
Sono Motors
Sion² (2022)
source:
Wikipedia
by S3412
Tesla
Cybertruck Beast² (2024)
source:
Wikipedia
by Smnt
Cybertruck AWD² (2024)
source:
Wikipedia
by Smnt
Cybertruck AWD with Expander² (2024)
source:
Wikipedia
by Smnt
Cybertruck RWD² (2025)
source:
Wikipedia
by Smnt
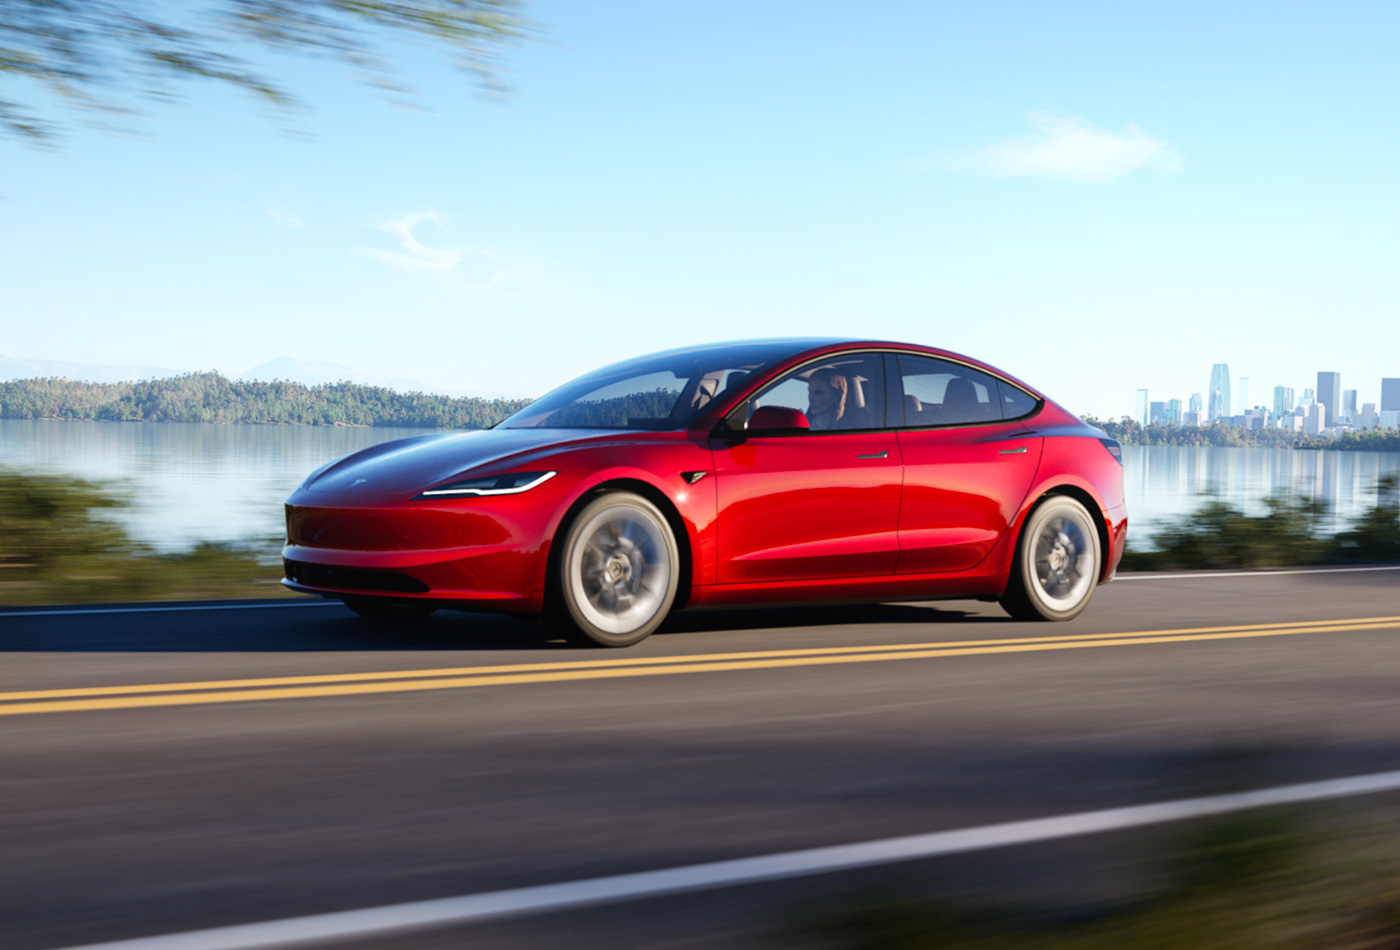
Model 3 Long Range AWD² (2023)
source:
Elektro Auto Mobil
Model 3 Standard Range Plus RWD² (2023)
source:
Elektro Auto Mobil
Model S Plaid² (2021)
source:
Tesla
Model S Long Range² (2021)
source:
Tesla
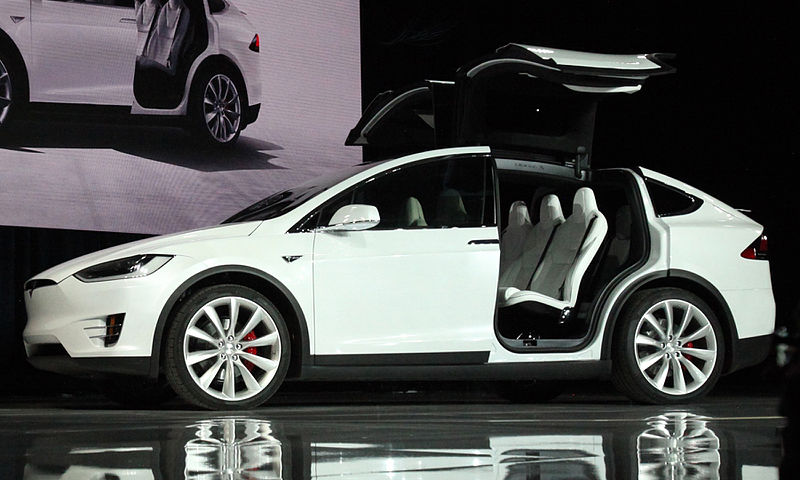
Model X Plaid² (2021)
source:
Tesla
Model X Long Range² (2021)
source:
Tesla
Model Y Performance AWD (2020)
source:
Wikipedia
by D.Cardenas
Model Y Long Range AWD (2020)
source:
Wikipedia
by D.Cardenas
Model Y Standard Range Plus RWD² (2022)
source:
Wikipedia
by D.Cardenas
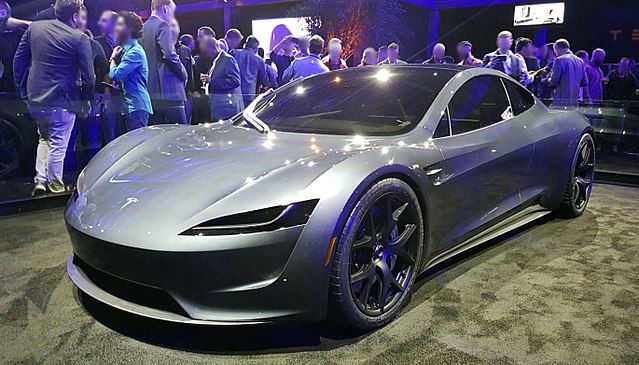
Roadster² (2022)
source:
Wikipedia
by Smnt
Model Y Long Range RWD° (2020)
source:
Wikipedia
by D.Cardenas
Model Y Standard Range Plus RWD° (2021)
source:
Wikipedia
by D.Cardenas
Model S Performance - Raven° (2019)
source:
Wikipedia
by Mariordo
Model S Long Range Plus - Raven° (2020)
source:
Wikipedia
by Mariordo
Model S Long Range - Raven° (2019)
source:
Wikipedia
by Mariordo
Model S Standard Range - Raven° (2019)
source:
Wikipedia
by Mariordo
Model X Performance - Raven° (2019)
source:
Wikipedia
by Mariordo
Model X Long Range Plus - Raven° (2020)
source:
Wikipedia
by Mariordo
Model X Long Range - Raven° (2019)
source:
Wikipedia
by Mariordo
Model X Standard Range - Raven° (2019)
source:
Wikipedia
by Mariordo
Model 3 Performance AWD° (2021)
source:
Wikipedia
by Seungho Yang
Model 3 Long Range AWD° (2021)
source:
Wikipedia
by Seungho Yang
Model 3 Standard Range Plus RWD - LFP° (2022)
source:
Wikipedia
by Seungho Yang
Model 3 Standard Range Plus RWD° (2020)
source:
Wikipedia
by Seungho Yang
Model 3 Standard Range RWD²° (2020)
source:
Wikipedia
by Seungho Yang
Model 3 Standard Range Plus RWD - LFP° (2021)
source:
Wikipedia
by Seungho Yang
Model 3 Performance AWD° (2020)
source:
Wikipedia
by Seungho Yang
Model 3 Long Range AWD° (2020)
source:
Wikipedia
by Seungho Yang
Model 3 Long Range RWD° (2020)
source:
Wikipedia
by Seungho Yang
Model 3 Mid Range RWD° (2020)
source:
Wikipedia
by Seungho Yang
Model 3 Performance AWD° (2018)
source:
Wikipedia
by Seungho Yang
Model 3 Long Range AWD (Aero Caps)° (2018)
source:
Wikipedia
by Seungho Yang
Model 3 Long Range AWD° (2018)
source:
Wikipedia
by Seungho Yang
Model 3 Long Range RWD° (2018)
source:
Wikipedia
by Seungho Yang
Model 3 Standard Range Plus RWD° (2019)
source:
Wikipedia
by Seungho Yang
Model 3 Standard Range RWD° (2019)
source:
Wikipedia
by Seungho Yang
Model 3 Long Range RWD° (2017)
source:
Wikipedia
by Seungho Yang
Model 3 Mid Range RWD° (2018)
source:
Wikipedia
by Seungho Yang
Model S Performance° (2018)
source:
Wikipedia
by Mariordo
Model S Long Range° (2018)
source:
Wikipedia
by Mariordo
Model X Performance° (2018)
source:
Wikipedia
by Mariordo
Model X Long Range° (2018)
source:
Wikipedia
by Mariordo
Model S 75° (2016)
source:
Wikipedia
by Mariordo
Model S 75D° (2016)
source:
Wikipedia
by Mariordo
Model S 100D° (2017)
source:
Wikipedia
by Mariordo
Model S P100D° (2017)
source:
Wikipedia
by Mariordo
Model S 90D° (2015)
source:
Wikipedia
by Granada
Model S P90D° (2015)
source:
Wikipedia
by Granada
Model S 85° (2012)
source:
Wikipedia
by Granada
Model S 85D° (2014)
source:
Wikipedia
by Granada
Model S P85° (2012)
source:
Wikipedia
by Granada
Model S P85plus° (2012)
source:
Wikipedia
by Granada
Model S P85D° (2015)
source:
Wikipedia
by Granada
Model S 70° (2015)
source:
Wikipedia
by Granada
Model S 70D° (2015)
source:
Wikipedia
by Granada
Model S 60° (2012)
source:
Wikipedia
by Granada
Model S 60D° (2016)
source:
Wikipedia
by Granada
Model X 100D° (2016)
source:
Wikipedia
by Mariordo
Model X P100D° (2016)
source:
Wikipedia
by Mariordo
Model X 90D° (2016)
source:
Wikipedia
by Mariordo
Model X P90D° (2016)
source:
Wikipedia
by Mariordo
Model X 75D° (2016)
source:
Wikipedia
by Mariordo
Model X 70D° (2016)
source:
Wikipedia
by Mariordo
Model X 60D° (2016)
source:
Wikipedia
by Mariordo
Roadster° (2008)
source:
Wikipedia
by Mariordo
Toyota
iQ EV² (2012)
source:
Wikipedia
by NJo
Prius III - XW50¹ (2016)
source:
Wikipedia
by Carsfera
Prius II - XW30¹° (2012)
source:
Wikipedia
by S 400 HYBRID
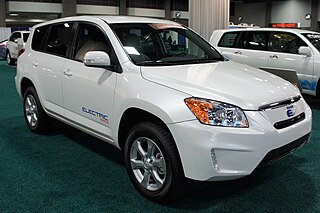
RAV4 EV° (2012)
source:
Wikipedia
by Mariordo
Uniti
One - 24kWh² (2022)
source:
Wikipedia
by Theo Little
One - 12kWh² (2022)
source:
Wikipedia
by Theo Little
Volvo
XC40 Recharge² (2020)
source:
Wikipedia
by Vauxford
VW
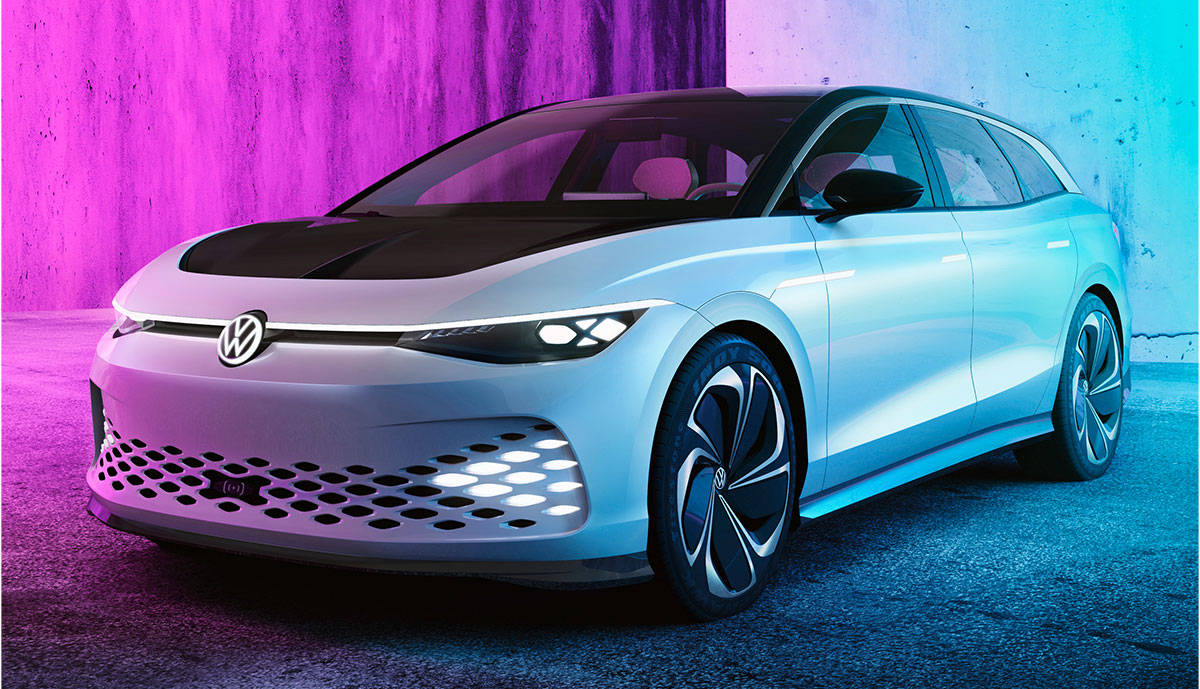
ID.Space Vizzion² (2023)
source:
ecomento.de
ID.Buzz (2022)
source:
Wikipedia
by AutobildEs
ID.3 1st (2020)
source:
Wikipedia
by Alexander Migl
ID.3 Pro S² (2021)
source:
Wikipedia
by Alexander Migl
ID.3 Pro² (2020)
source:
Wikipedia
by Alexander Migl
ID.3 Pure² (2021)
source:
Wikipedia
by Alexander Migl
ID.4 1st (2020)
source: Photo by U. Brinkman
ID.4 Pro Performance² (2021)
source: Photo by U. Brinkman
ID.5 Pro (2022)
source:
Wikipedia
by Alexander Migl
ID.5 Pro Performance (2022)
source:
Wikipedia
by Alexander Migl
ID.5 GTX (2022)
source:
Wikipedia
by Alexander Migl
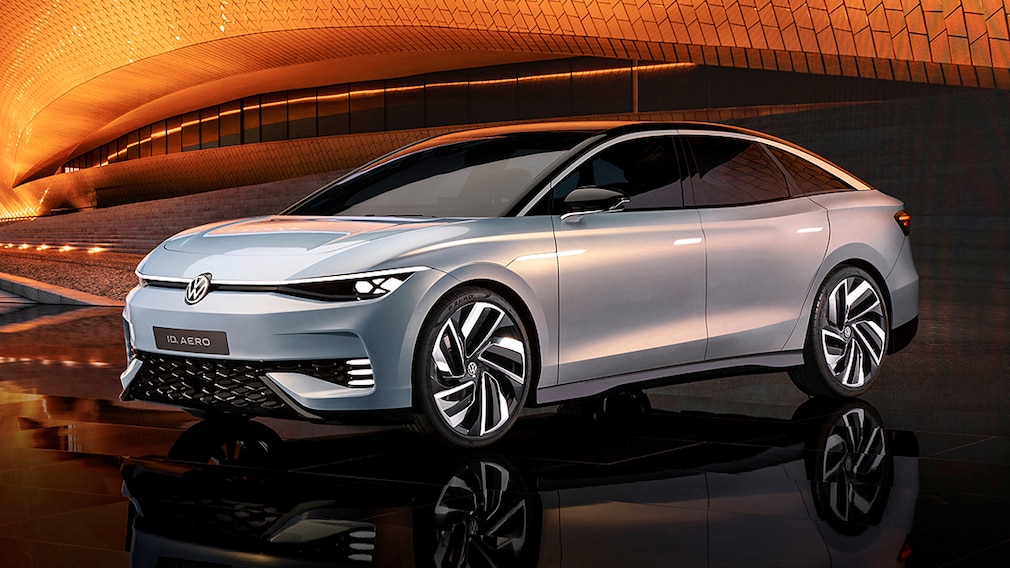
ID.7 (ID.AERO)² (2023)
source:
Autobild
e-Crafter² (2018)
source:
Wikipedia
by F. Schwichtenberg
e-Golf (2017)
source:
Wikipedia
by M 93
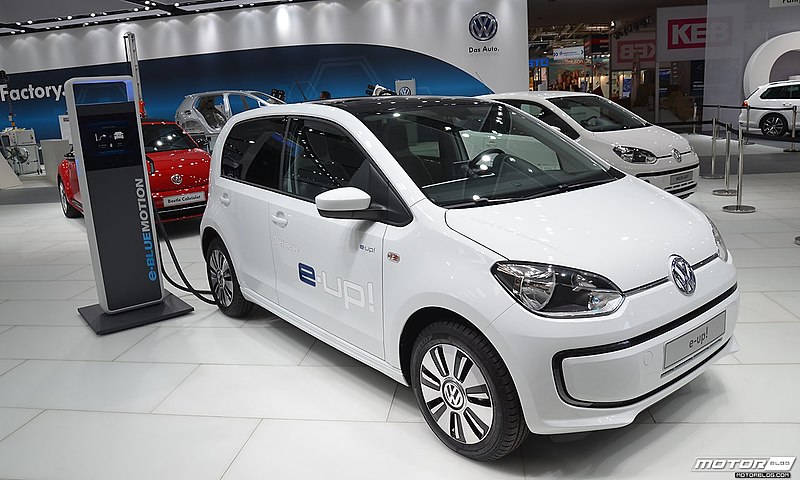
eUp (2020)
source:
Wikipedia
by MotorBlog
e-Golf° (2014)
source:
Wikipedia
by Mariordo
eUp° (2013)
source:
Wikipedia
by MotorBlog
Xiaomi
SU7 RWD² (2024)
source:
Wikipedia
by JustAnotherCarDesigner
SU7 Pro² (2024)
source:
Wikipedia
by JustAnotherCarDesigner
SU7 Max² (2024)
source:
Wikipedia
by JustAnotherCarDesigner
Xpeng Motors
G3 460i² (2020)
source:
Wikipedia
by Jengtingchen
G3 520i² (2020)
source:
Wikipedia
by Jengtingchen
P7 AWD² (2020)
source:
Wikipedia
by Jengtingchen
P7 RWD LR² (2020)
source:
Wikipedia
by Jengtingchen
P7 RWD² (2020)
source:
Wikipedia
by Jengtingchen
Buses
Bus 1 - Small (2022)
source:
Wikipedia
by SanJoaquinRTD
Bus 2 - Medium (2022)
source:
Wikipedia
by SanJoaquinRTD
Bus 3 - Large (2022)
source:
Wikipedia
by SanJoaquinRTD
|
Links to Car Maker